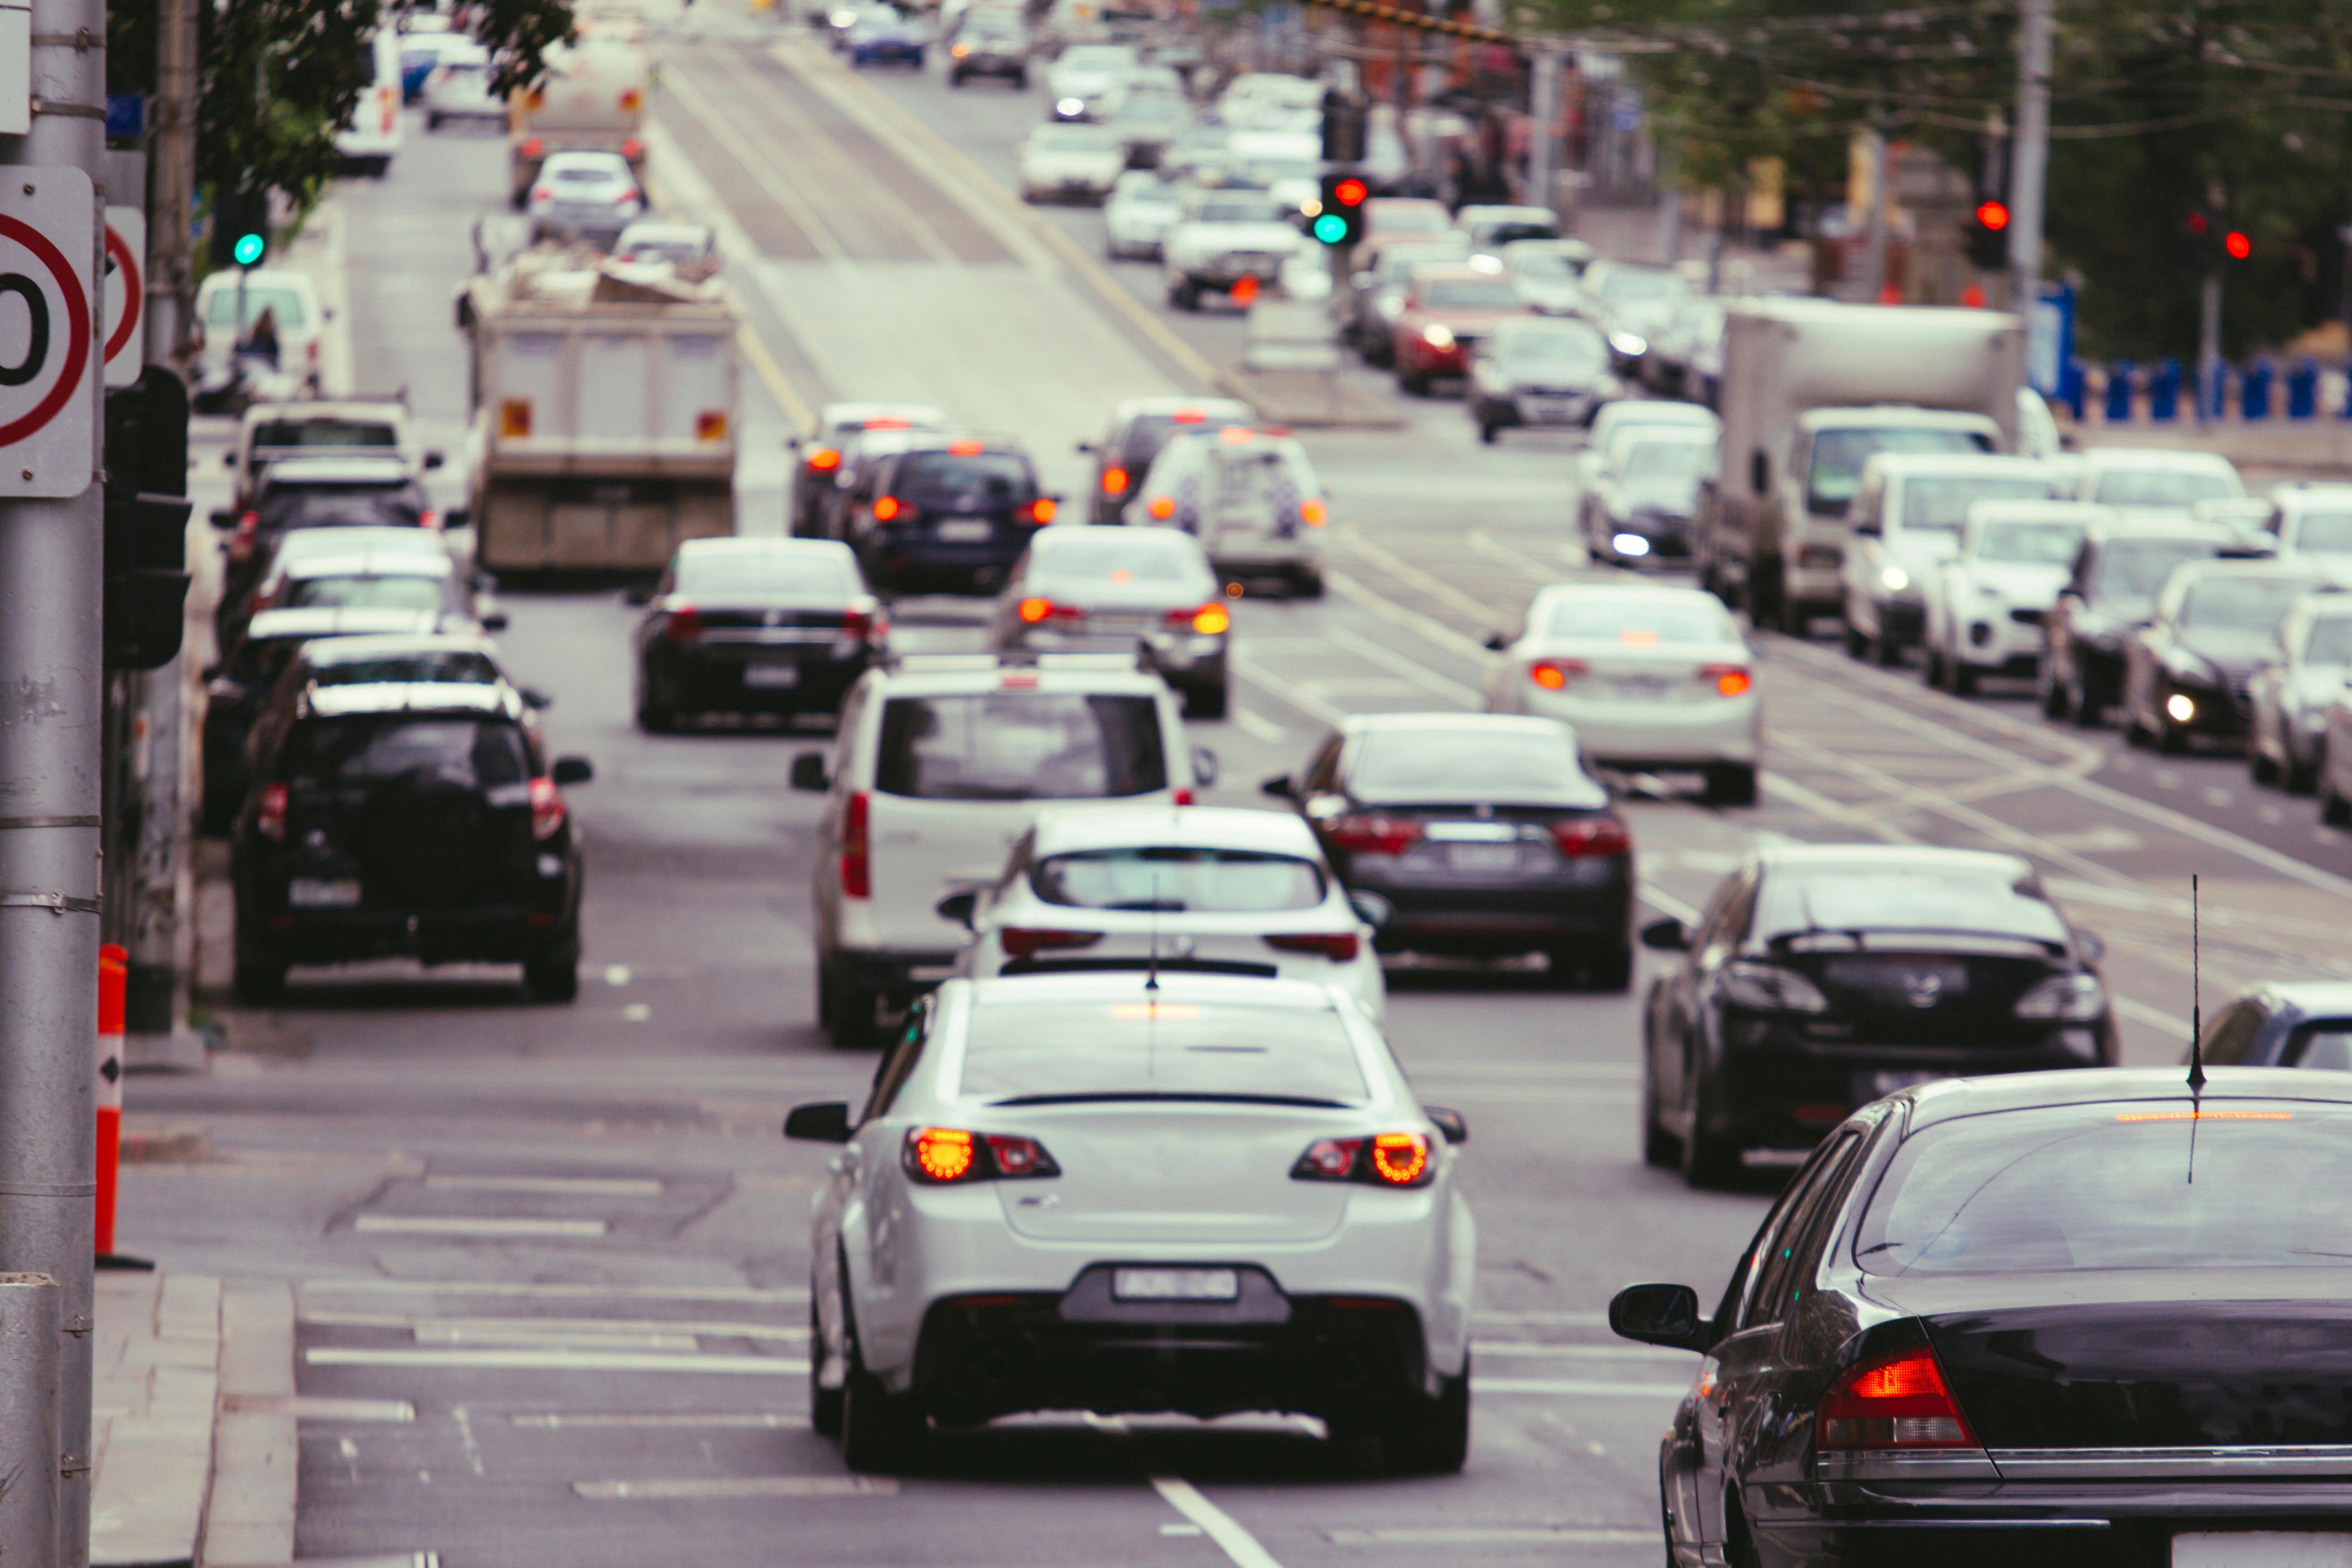
Traffic is costing full-time drivers in Australia’s biggest cities thousands of dollars a year in lost time and fuel, according to new analysis for iSelect’s Delayed Drives report.
Across the 11 largest cities, commuters who drive to work collectively lose about 212 million hours a year in traffic and spend another $462 million in extra fuel.
The estimated cost to the economy is $9.7 billion, based on the lost opportunity cost – ie the loss of potential gain due to congestion.
In total, therefore, traffic is costing drivers more than $10.1 billion annually.
CarExpert can save you thousands on a new car. Click here to get a great deal.

On a per-driver basis, the study finds the average full-time worker in Australia’s major cities loses around 59 hours a year to traffic, or roughly two and a half days, at an average annual cost of about $2788 in time and fuel.
| Key metric | Figure |
|---|---|
| Total time lost in traffic (11 cities) | ~212 million hours per year |
| Total annual congestion cost | Just over $10.1 billion |
| Average per full-time driver (major cities) | ~59 hours a year (~2.5 days) |
| Average per-driver cost | Around $2788 a year |
| Most expensive city for drivers | Melbourne – $4628 a year, 3d 22h lost |
| City with most time lost | Sydney – $4568 a year, 4d 0h 25m lost |
| Least impacted city | Darwin – $1390 a year, 1d 3h 32m lost |
| Highest cost occupation | Medical practitioners – $6784 a year |
Using TomTom traffic data, ABS Census commuting patterns, median hourly earnings, and real-world fuel consumption, the analysis compares how congestion hits drivers in each city’s CBD and wider metro area.
On cost, Melbourne comes out worst. The typical full-time driver there loses 3 days, 22 hours and 5 minutes to traffic each year, with an estimated annual congestion bill of $4628, made up of about $4457 in lost time and $171 in extra fuel.
Sydney drivers lose slightly more time to traffic overall, at 4 days and 25 minutes per year, but slightly less money, at $4568 a year in combined time and fuel costs. Most of that is the opportunity cost of time, at around $4406 a year, plus $162 in extra fuel.
Perth, Brisbane and Adelaide round out the top five cities on annual congestion cost, each above $3300 a year for time and fuel combined. At the other end of the scale, Darwin drivers lose about 1 day, 3 hours and 32 minutes a year to traffic, at a cost of around $1390.
When the focus shifts to CBD driving, Adelaide has the slowest inner-city rush-hour traffic in the study.
On a typical 20km round trip through the city centre, Adelaide drivers lose about 22 minutes and 10 seconds a day compared to free-flow conditions. That adds up to roughly 3 days and 13 hours a year spent sitting in traffic, with an average rush-hour congestion level of about 66 per cent.
Melbourne’s city centre is only just behind, with drivers losing about 21 minutes and 55 seconds a day on the same 20km round trip, or 3 days and 12 hours a year, while Sydney and Brisbane follow. Wollongong and Darwin record the smallest CBD time losses, with drivers there losing a little over 7 minutes a day to inner-city congestion.
Looking at the wider metro areas, Sydney is again hardest hit. Across the greater metropolitan region, the average rush-hour speed drops to around 27km/h, turning a 20km return commute into more than 44 minutes on the road and costing drivers about 15 minutes a day in extra travel time compared to optimal conditions.
Melbourne ranks second on metro congestion, followed by Adelaide, Newcastle and the Gold Coast, while Darwin again has the smoothest runs.
The burden isn’t spread evenly across the workforce. When the data is broken down by occupation, stationary plant operators lose the most time, with long average commutes, little or no work from home and 4 days, 10 hours and 7 minutes a year lost to traffic.
Defence force members, firefighters and police are close behind on time lost, at 4 days, 5 hours and 12 minutes a year, followed by medical practitioners and several technical and trade occupations that also spend more than four days a year in congestion.
On pure dollar cost, medical practitioners are hit hardest. With a median hourly wage of about $65.60 and more than four days a year lost in traffic, their combined time and fuel bill comes to around $6784 a year. Air and marine transport professionals, health diagnostic and promotion professionals, ICT managers and advertising and PR managers all face congestion costs in the $5100 to $5400 range.
For drivers in these roles, congestion is effectively an unpaid extension of the workday, and for many city commuters, the study suggests traffic is now a high hidden cost of holding down a job that relies on the car.
The Delayed Drives modelling is based on ABS 2021 Census data and the ABS Characteristics of Employment 2024 for commute distances, work-from-home days and hourly earnings, combined with petrol prices from the ACCC’s June 2025 Australian Petroleum Market Report, real-world fuel consumption figures from the Real World Testing Program, and drivetrain mix data from BITRE’s Road Vehicles Australia 2025 report.
Table 1: Annual congestion time and cost by city
(Full-time workers who drive to work, 2025 estimates)
| Rank | City | Yearly time lost to traffic | Annual congestion cost (time + fuel) | Of which lost time | Extra fuel cost |
|---|---|---|---|---|---|
| 1 | Melbourne | 3 days, 22 hr, 5 min | $4628 | $4457 | $171 |
| 2 | Sydney | 4 days, 0 hr, 25 min | $4568 | $4406 | $162 |
| 3 | Perth | 2 days, 21 hr, 35 min | $3496 | $3292 | $204 |
| 4 | Brisbane | 3 days, 1 hr, 46 min | $3447 | $3259 | $188 |
| 5 | Adelaide | 3 days, 5 hr, 50 min | $3377 | $3225 | $152 |
| 6 | Newcastle | 2 days, 6 hr, 12 min | $2587 | $2409 | $178 |
| 7 | Gold Coast | 2 days, 4 hr, 45 min | $2443 | $2244 | $199 |
| 8 | Canberra | 1 day, 16 hr, 14 min | $2244 | $2118 | $126 |
| 9 | Hobart | 1 day, 20 hr, 58 min | $1856 | $1700 | $156 |
| 10 | Wollongong | 1 day, 15 hr, 21 min | $1814 | $1574 | $240 |
| 11 | Darwin | 1 day, 3 hr, 32 min | $1390 | $1213 | $176 |
Table 2: City centre rush-hour delays, by city
(Typical 20km round trip through CBD, 2025 estimates)
| Rank | City | Daily extra time in traffic | Extra time in rush hour per year | Rush-hour congestion level |
|---|---|---|---|---|
| 1 | Adelaide | 22 min 10 sec | 3 days 13 hours | 66.0% |
| 2 | Melbourne | 21 min 55 sec | 3 days 12 hours | 66.6% |
| 3 | Sydney | 19 min 34 sec | 3 days 3 hours | 53.3% |
| 4 | Brisbane | 18 min 31 sec | 2 days 23 hours | 60.3% |
| 5 | Gold Coast | 15 min 39 sec | 2 days 12 hours | 50.9% |
| 6 | Perth | 14 min 21 sec | 2 days 7 hours | 53.1% |
| 7 | Newcastle | 13 min 34 sec | 2 days 4 hours | 45.7% |
| 8 | Hobart | 13 min 34 sec | 2 days 4 hours | 48.6% |
| 9 | Canberra | 11 min 29 sec | 1 day 20 hours | 44.9% |
| 10 | Wollongong | 7 min 50 sec | 1 day 6 hours | 35.0% |
| 11 | Darwin | 7 min 18 sec | 1 day 4 hours | 30.5% |
Table 3: Occupations losing the most time in traffic
(Top 10 by yearly time lost, Australia-wide, full-time workers who drive to work)
| Rank | Occupation | Yearly time lost to traffic | Annual congestion cost (time + fuel) |
|---|---|---|---|
| 1 | Stationary plant operators | 4 days, 10 hr, 7 min | $4892 |
| 2 | Defence force members, firefighters and police | 4 days, 5 hr, 12 min | $4955 |
| 3 | Medical practitioners | 4 days, 4 hr, 9 min | $6784 |
| 4 | Health diagnostic and promotion professionals | 4 days, 2 hr, 31 min | $5418 |
| 5 | Electronics and telecommunications trades workers | 4 days, 0 hr, 46 min | $4574 |
| 6 | Building and engineering technicians | 3 days, 18 hr, 22 min | $4893 |
| 7 | Health therapy professionals | 3 days, 17 hr, 51 min | $4678 |
| 8 | Midwifery and nursing professionals | 3 days, 14 hr, 42 min | $4608 |
| 9 | Engineering professionals | 3 days, 12 hr, 39 min | $4953 |
| 10 | Natural and physical science professionals | 3 days, 9 hr, 53 min | $4596 |